I’m working on a series for DevOps.com to explain Functional Ops (expect it to start early next week!) and it’s very hard to convey it’s east-west API nature. So I’m always excited to see how other people explain how OpenCrowbar does ops and ready state.
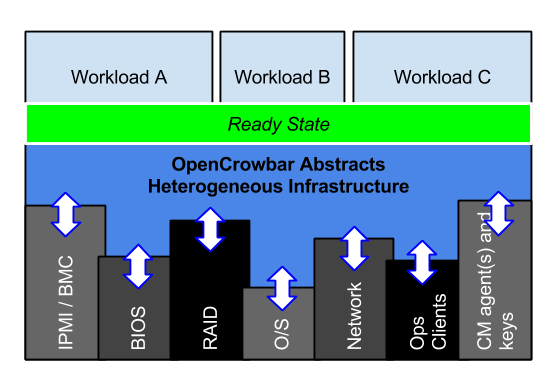 This week I was blown away by the drawing that I’ve recreated for this blog post. It’s very clear graphic showing the operational complexity of heterogeneous infrastructure AND how OpenCrowbar normalizes it into a ready state.
It’s critical to realize that the height of each component tower varies by vendor and also by location with in the data center topology. Ready state is not just about normalizing different vendors gear; it’s really about dealing with the complexity that’s inherent in building a functional data center. It’s “little” things liking knowing how to to enumerate the networking interfaces and uplinks to build the correct teams.
If you think this graphic helps, please let me know.
